Micro-services Using go-kit: Centralized Logging Using ELK Stack
Logging means nothing if you cannot collect and analyze it.

Introduction
In the previous article, I already explain how to add logging capability into lorem service. However, it is not sufficient in terms of logging perspective. So, why it is not enough? There are two reasons. First, I still log into OS standard output. Let say I want to trace yesterday log. It is possibly will not be there anymore. Second, it is not centralized. Imagine you have hundreds of services, it would be like hell to trace which services caused an error.
Therefore, I will try to address those two issues in this article. My first step is to change the logging output from OS standard output into log files. In that case, I resolve the first issue. Next one is to centralize the logs. For this purpose, I am going to use Elasticsearch, Logstash and Kibana or as know as an ELK stack.
ELK Stack
ELK stack is one of the most widely deployed platforms for collecting, indexing and visualizing logs. The setup has main four components:
- Elasticsearch: store all the logs
- Logstash: to process incoming logs.
- Kibana: web interface for searching and visualizing logs. Will use nginx as a reverse proxy.
- Filebeat: installed on client to send logs to Logstash.

For the purpose in this article, I already made a vagrant setup for ELK server. Just clone it from my GitHub repository. All you need to do is only to type vagrant up. Then virtual machine will provision all required setups in order to make this stack run. The provisions itself use Ansible and the playbooks are located under provision/ folder.
Setting Up Virtual Machine
A couple of notes for these setup, I disabled the SSL configuration while setting up Logstash. However, this is not recommended in the production environment. If you want to enable it, just remark line include: ssl.yml under provision/roles/logstash/tasks/main.yml.
The next one, I created Kibana administration user using openssl and put it under /etc/nginx/htpasswd.users. The default username is admin with password admin. You should never use this default configuration. Whenever you want to change the username and password, just change it under provision/roles/nginx/tasks/main.yml. Find a line with name:add kibana users.
After all, it is time to configure the Logstash filter. Logstash itself already has many of filter plugins. Before we pick which plugins is suitable for our needs, just take a look the log from previous article.
|
1 2 3 |
# sample output ts=2017-03-11T02:31:15.053799466Z caller=logging.go:31 function=Word min=10 max=10 result=exhibentur took=3.366µs # end of sample output |
This type of log is perfectly match with logstash-kv-filter. All is good. Now put configuration for this KV filter and give it a name 09-gokit-filter.conf.
|
1 2 3 4 5 6 7 8 9 10 11 |
filter { if [type] == "gokitlog"{ kv { add_field => [ "received_at", "%{@timestamp}" ] add_field => [ "received_from", "%{host}" ] } date { match => [ "ts", "MMM d HH:mm:ss", "MMM dd HH:mm:ss", "ISO8601" ] } } } |
Note: All Logstash configuration files can be found under
provision/roles/logstash/files/More information about this
vagrant-elksetup, please take a look atREADME.md.
Refactor lorem-logging
In this step, we only need to change the logging output from OS stdout into a file. To main.go:
|
1 2 3 4 5 6 7 8 9 10 11 12 13 14 15 |
// excerpt logfile, err := os.OpenFile("./gokit-playground/log/lorem/golorem.log", os.O_RDWR | os.O_CREATE | os.O_APPEND, 0666) if err != nil { panic(err) } defer logfile.Close() // Logging domain. var logger log.Logger { w := log.NewSyncWriter(logfile) logger = log.NewLogfmtLogger(w) logger = log.With(logger, "ts", log.DefaultTimestampUTC) logger = log.With(logger, "caller", log.DefaultCaller) } |
Note: for simplicity I only use simple logging file. Whenever you need more capabilities like log rotation, you can use lumberjack.
Filebeat
Just as previously stated, I am going to use Filebeat to ship logs from lorem service into Logstash. The only thing for this step is only setting up the configuration under filebeat.yml.
|
1 2 3 4 5 6 7 8 9 10 11 12 13 14 15 16 17 18 19 20 21 22 23 24 |
# filebeat.yml filebeat: prospectors: - paths: - "/golorem.log" input_type: log document_type: gokitlog output: logstash: enabled: true hosts: ["172.20.20.10:5044"] bulk_max_size: 1024 console: pretty: true shipper: logging: files: rotateeverybytes: 10485760 # = 10MB # end of filebeat.yml |
Note: prospector path is set to
/golorem.log. Meanwhile, in themain.gothe path points to./gokit-playground/log/lorem/golorem.log. This is on purpose because I am going to use docker and mounting the volume into this path.
Dockerized Filebeat
The last thing to make this runs is having Filebeat installed in your computer. But, because this is my laptop, I will not install it. Instead, I am going to use Docker with Filebeat container to ship the logs.
I will use image from fiunchinho/docker-filebeat and mounting two volumes. First volume goes to filebeat.yml and the other one goes to log file itself. For all these things, I created a docker-compose-filebeat.yml in order to make it available whenever I execute docker compose command.
|
1 2 3 4 5 6 7 8 9 10 11 12 13 14 15 |
# Sample of docker compose file version: '2' services: filebeat: image: fiunchinho/docker-filebeat environment: LOGSTASH_HOST: 172.20.20.10 LOGSTASH_PORT: 5044 INDEX: logstash volumes: - $PWD/lorem-logging/filebeat/filebeat.yml:/filebeat.yml - $PWD/log/lorem/golorem.log:/golorem.log # End of sample |
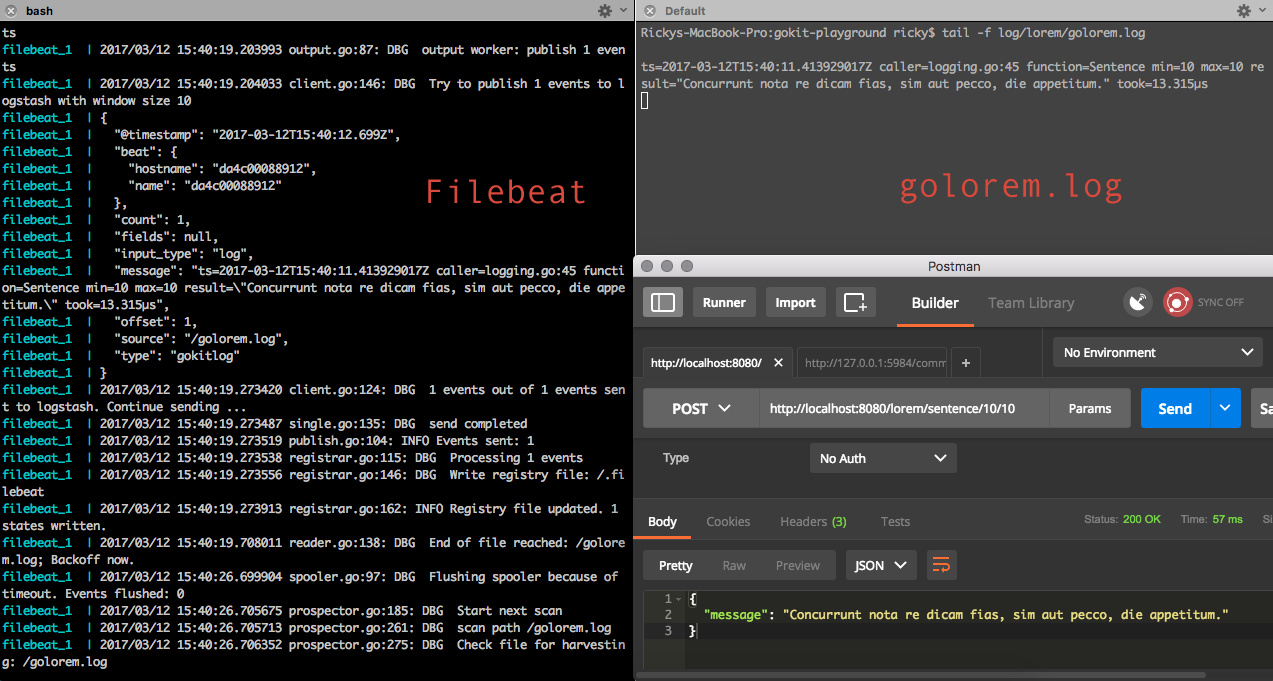
Demo
To run this demo, there are several steps:
- Run the virtual box
1234# go to vagrant-elk directorycd vagrant-elkvagrant up# this vm uses private network with IP Address 172.20.20.10 - Run lorem-logging server
123# go to GOPATHcd $GOPATH/src/github.com/ru-rocker/gokit-playgroundgo run lorem-logging/lorem-logging.d/main.go - Run Filebeat by using docker
123# Go to gokit-playground directorycd $GOPATH/src/github.com/ru-rocker/gokit-playgrounddocker-compose -f docker/docker-compose-filebeat.yml up - Make HTTP request
1234# wordcurl -X POST http://localhost:8080/lorem/word/10/10# sentencecurl -X POST http://localhost:8080/lorem/sentence/10/10
If there is no problem, we will get output such as:
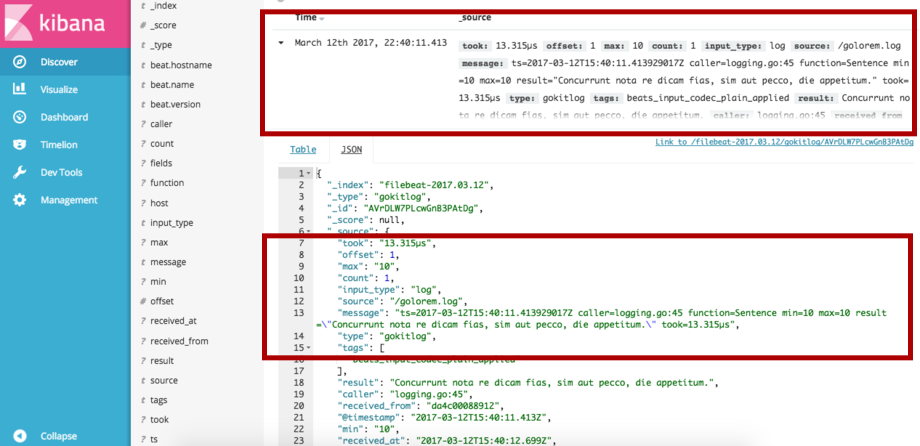
Conclusion
Afterwards, by using centralized log architecture, it is easier for us to collect, analyze and visualize logs. Also, whenever something goes wrong, we can spot the problem faster because we can search the logs by using keywords. So it is going to make our life easier, isn’t it?
In general, what my article only spoke about basic logging functionality. You can do far more better. Such as logged username and their session ID. What are their preferences on your services. So you can get lots of information about your customers.
Alright, that’s all from me for this article. Have a nice day!
PS: all the source code can be downloaded here.
One thought on “Micro-services Using go-kit: Centralized Logging Using ELK Stack”