Micro-services Using go-kit: API Monitoring
API monitoring is essential because APIs are the only interaction mechanism between your services and outside world.
Overview
 Basically, all active systems needs to be monitored. Monitoring is a pivotal component because we want to make sure that everything works perfectly. There is no exception for micro-services architecture as well. We have to monitor our API in real time and historical in order to know whether it is running well over the time. Another reason is to spot any bottleneck in specific API calls. So we can have a proper reaction if we find any problem in our API.
Prometheus
 Prometheus is gaining its popularity as a monitoring tools for storing time series data. It provides various metric types, such as:
 Counter, Gauge, Histogram and Summary. Also, Prometheus gives functional expression language to select and aggregate time series data. The result can be viewed as a graph or tabular data.
However, sometimes we need better visualization. For this case, we could combine Prometheus with Grafana in order to have an amazing tools to analyze and visualize the data. Prometheus provides the data, meanwhile Grafana provides dashboards as an interface to analyze and visualize the data.
Prometheus vs ELK
In my previous article, I talked about logging monitoring with ELK stack. Meanwhile, Prometheus is another monitoring tools as well. What is the different then? Well, based on their FAQ page, Prometheus is a system to collect and process metrics, not an event logging system. So it is clear both tools have different functionality. One is for collecting event logging (ELK) and the other one is to collect and process metrics (Prometheus).
How Does It Work
Simply, we configure our monitored targets in the configuration file. Then Prometheus starts to collects metrics from targets by scraping an HTTP endpoint on these targets.
More about Prometheus and Grafana, visit their website on www.prometheus.io and www.grafana.com.
Use Case
In this article, I will monitor request count and the request latency. Then I will expose into metrics endpoint. Prometheus will scrap data from metrics endpoint and visualize them using Grafana.
For this purpose, I copied lorem-rate-limit folder into new folder and give it a name lorem-metrics.
Note: Prometheus and Grafana will be run on Docker.
Step by Step
Before we begin, we need to download required libraries through go get command.
|
1 2 |
# download prometheus library go get github.com/prometheus/client_golang/prometheus |
Step 1: Update instrument.go
First, create new struct, name it metricsMiddleware. This struct extends Service function with two additional parameters: requestCounter and requestLatency.
|
1 2 3 4 5 6 7 |
// Make a new type and wrap into Service interface // Add expected metrics property to this type type metricsMiddleware struct { Service requestCount metrics.Counter requestLatency metrics.Histogram } |
Next, we create a new function and give it a name Metrics. The function will accept two input parameters, which are requestCounter and requestLatency. And it will return ServiceMiddleware wrapper, which basically is another function that return Service.
|
1 2 3 4 5 6 7 8 9 10 11 |
// metrics function func Metrics(requestCount metrics.Counter, requestLatency metrics.Histogram) ServiceMiddleware { return func(next Service) Service { return metricsMiddleware{ next, requestCount, requestLatency, } } } |
And we implement Service function for our new metricsMiddleware struct.
|
1 2 3 4 5 6 7 8 9 10 11 |
// Implement service functions and add label method for our metrics func (mw metricsMiddleware) Word(min, max int) (output string) { defer func(begin time.Time) { lvs := []string{"method", "Word"} mw.requestCount.With(lvs...).Add(1) mw.requestLatency.With(lvs...).Observe(time.Since(begin).Seconds()) }(time.Now()) output = mw.Service.Word(min, max) return } // and the rest for Sentence and Paragraph |
Step 2: transport.go
We need another router for handling metrics path. Inside MakeHttpHandler function, add:
|
1 2 |
// GET /metrics r.Path("/metrics").Handler(stdprometheus.Handler()) |
Step 3: main.go
In this file, first we need to declare variable for requestCounter. Since this is a counter, we will use Prometheus Counter metric type (See sub-heading Prometheus). And another variable for requestLatency with Summary metric type.
|
1 2 3 4 5 6 7 8 9 10 11 12 13 14 |
//declare metrics fieldKeys := []string{"method"} requestCount := kitprometheus.NewCounterFrom(stdprometheus.CounterOpts{ Namespace: "ru_rocker", Subsystem: "lorem_service", Name: "request_count", Help: "Number of requests received.", }, fieldKeys) requestLatency := kitprometheus.NewSummaryFrom(stdprometheus.SummaryOpts{ Namespace: "ru_rocker", Subsystem: "lorem_service", Name: "request_latency_microseconds", Help: "Total duration of requests in microseconds.", }, fieldKeys) |
And chaining it into existing service:
|
1 2 3 4 5 |
// chaining service var svc lorem_metrics.Service svc = lorem_metrics.LoremService{} svc = lorem_metrics.LoggingMiddleware(logger)(svc) svc = lorem_metrics.Metrics(requestCount, requestLatency)(svc) |
Note: see highlighted line for including metrics into existing service.
Step 4: Prometheus and Grafana
As I mentioned above, we will going to setup Prometheus and Grafana using docker compose file. I will use official docker images, which are prom/prometheus and grafana/grafana.
Prometheus
For running Prometheus inside docker, at minimum we need to create prometheus.yml file and mount the configuration file into prometheus image.
|
1 2 3 4 5 6 7 8 9 10 11 12 13 14 15 16 17 18 19 |
global: scrape_interval: 15s # By default, scrape targets every 15 seconds. external_labels: monitor: 'rurocker-monitor' scrape_configs: - job_name: 'prometheus' scrape_interval: 5s static_configs: - targets: ['localhost:9090'] labels: group: 'local' - job_name: 'ru-rocker' scrape_interval: 5s static_configs: - targets: ['192.168.1.103:8080'] labels: group: 'lorem' |
Note: I am using IP Address (highlighted) instead of localhost for lorem service because this configuration will be executed inside container.
Grafana
For Grafana, we need create an empty folder to be mounted inside container then named it grafana_db (you are free to select another name). The purpose for this folder is as a storage location for SQLite data. As you may know, Grafana is using SQLite for its data store. Next step is to specify administrator password by overriding GF_SECURITY_ADMIN_PASSWORD environment variables.
docker-compose-prometheus-grafana.yml
|
1 2 3 4 5 6 7 8 9 10 11 12 13 14 15 16 17 |
version: '2' services: prometheus: image: prom/prometheus ports: - 9090:9090 volumes: - $PWD/lorem-rate-limit/prometheus/prometheus.yml:/etc/prometheus/prometheus.yml grafana: image: grafana/grafana ports: - 3000:3000 environment: - GF_SECURITY_ADMIN_PASSWORD=password volumes: - $PWD/extra/grafana_db:/var/lib/grafana grafana/grafana |
Step 5: Run
Now it is time to run the demo. First we will start our lorem-service and check whether path /metrics exists. We will invoke several request into the service in order to retrieve metrics data. Next start our container to bring up Prometheus and Grafana.
lorem-service
|
1 2 3 4 5 6 7 8 9 |
# start service cd $GOPATH/src/github.com/ru-rocker/gokit-playground go run lorem-metrics/lorem-metrics.d/main.go # calling service via CURL # you can execute this multiple times in a different time to get a nice spectrum for i in 1 2 3 4 5; do curl -X POST localhost:8080/lorem/word/10/10; done for i in 1 2 3 4 5; do curl -X POST localhost:8080/lorem/sentence/10/10; done for i in 1 2 3 4 5; do curl -X POST localhost:8080/lorem/paragraph/10/10; done |
Prometheus – Grafana
|
1 2 |
cd $GOPATH/src/github.com/ru-rocker/gokit-playground docker-compose -f docker/docker-compose-prometheus-grafana.yml up -d |
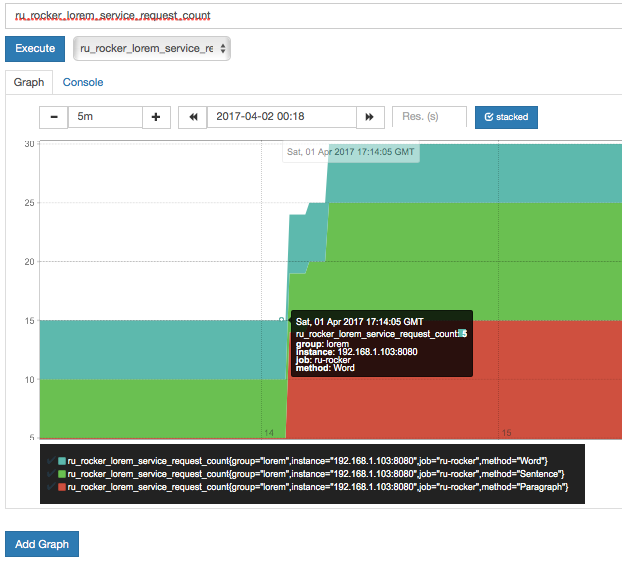
If everything runs well, you can check Prometheus at localhost:9090 and Grafana at localhost:3000. Grafana will ask you username and password. You can type admin as user name and your password based on your GF_SECURITY_ADMIN_PASSWORD in the compose file.
We need to configure Grafana for the first time. First we need to set up the data source. Create new data source, give it a Name, choose Type: Prometheus and set URL into localhost:9090. Next we need to setup a dashboard. Create new dashboard (Menu -> Dashboard -> New) and click Graph icon. Then click Panel Title and click Edit. Then you will see Metrics tab under the panel. You can use query expression to gather the metrics from lorem-service. For this example, I will gather total request count per method (word, sentence or paragraph).
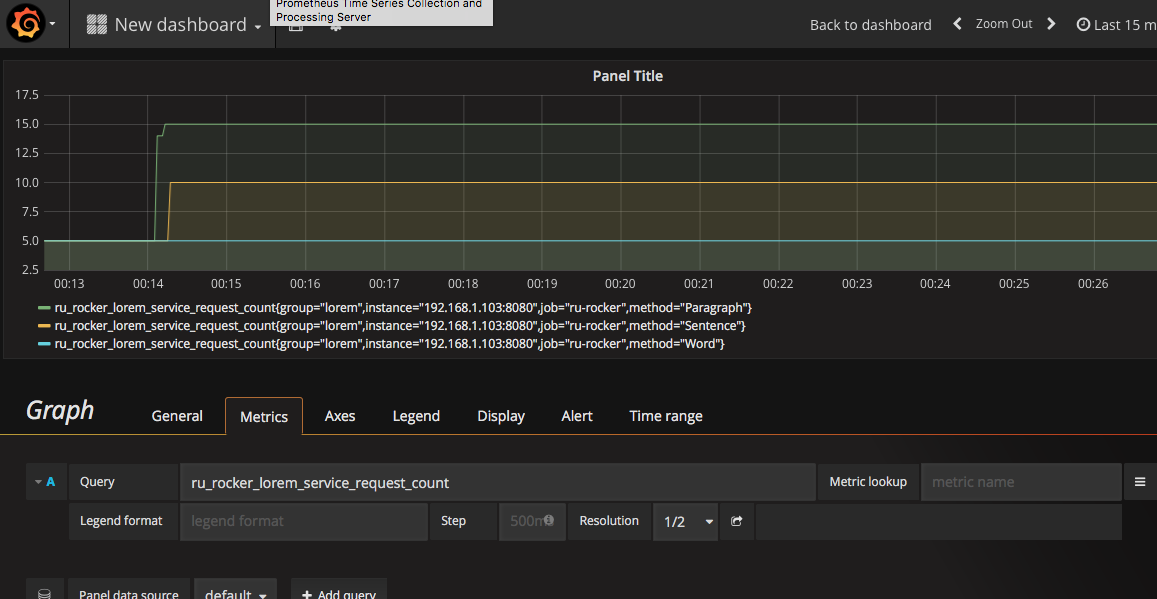
Note: you can try with another query, such as for request latency.
Conclusion
Whenever we expose our API publicly, it is the right moment to think about its visibility. We need to know whether everything works properly or not. Therefore we need monitoring tools.
Go-kit has shown one of its lovely feature to support this functionality. We do not need to refactor our existing code. Only adding one metrics functionality, wrap it into service and expose metrics URL. That’s it.
However, even we have a very sophisticated and advance monitoring system, without our reaction, everything is useless. Because monitoring needs our reaction. Properly.
All right, that’s all for today. You can still checkout my code on my github.
2 thoughts on “Micro-services Using go-kit: API Monitoring”